
Sloppy Science is a Statistical Sin
Evidence of sloppy science encourages readers to wonder if the entire research project is compromisedI have often written (for example, here) about the credibility crisis that is undermining the reputation of science and scientists. An alarming number of well-publicized “scientific” findings have been overturned when tested with fresh data. For example, the claim that a simple two-minute “power pose” can “Get your testosterone up; get your cortisol down” was touted in a best-selling book and in one of the most-watched TED talks of all time. But replication tests with fresh data found little or no effects and the lead author of the original study disavowed it: “As evidence has come in over these past 2+ years, my views have updated to reflect the evidence. As such, I do not believe that ‘power pose’ effects are real.”
It is the nature of scientific progress that theories get modified, amended, or abandoned as they are subjected to new tests. As John Maynard Keynes is credited with saying, “When the facts change, I change my mind. What do you do, sir?” On the other hand, the credibility of science suffers when the mind-changing happens because, as with the power-pose study, the original research was flawed.
Five statistics sins
There are five distinct statistics sins that fuel the replication crisis — p-hacking, HARKing, fraud, pursuing agendas, and carelessness. I have written a great deal about the first four of these five sins (for example, p-hacking, HARKing, fraud, and pursuing agendas). But I have written relatively little about carelessness, which might be described as sloppy science — flawed experiments, incomplete analysis, calculation errors, and inattention to important details.
Evidence of sloppy science encourages readers to wonder if the entire research project is compromised.
For example, questions about sloppy science in Cornell professor Brian Wansink’s food studies led to careful scrutiny that turned up numerous problems. In a paper titled “Statistical heartburn: An attempt to digest four pizza publications from the Cornell Food and Brand Lab,” Tim van der Zee, Jordan Anay, Nicholas J L Brown wrote that they had found 150 apparent errors in four of Wansink’s papers:
The sample sizes for the number of diners in each condition are incongruous both within and between the four articles. In some cases, the degrees of freedom of between-participant test statistics are larger than the sample size, which is impossible. Many of the computed F and t statistics are inconsistent with the reported means and standard deviations. In some cases, the number of possible inconsistencies for a single statistic was such that we were unable to determine which of the components of that statistic were incorrect.
The rampant mistakes undermined the credibility of Wansink’s research. He resigned after a Cornell faculty committee found that he had committed academic misconduct in “his research and scholarship, including misreporting of research data, problematic statistical techniques, failure to properly document and preserve research results, and inappropriate authorship.”
I recently encountered another example of sloppy science. A friend sent me a link to a paper by Steve H. Hanke, a prominent monetarist economist, which reported that his study of 147 countries showed “a tight linkage between changes in the money supply (M2) and inflation.”
The centerpiece of this conclusion is a scatterplot of each country’s geometric mean annual increase in money and prices during the years 1990 through 2021. The correlation between the percentage changes in money and prices is 0.96 and the slope is 0.96, leading Hanke to conclude that “the money supply growth rate and inflation have a near one-to-one relationship.”
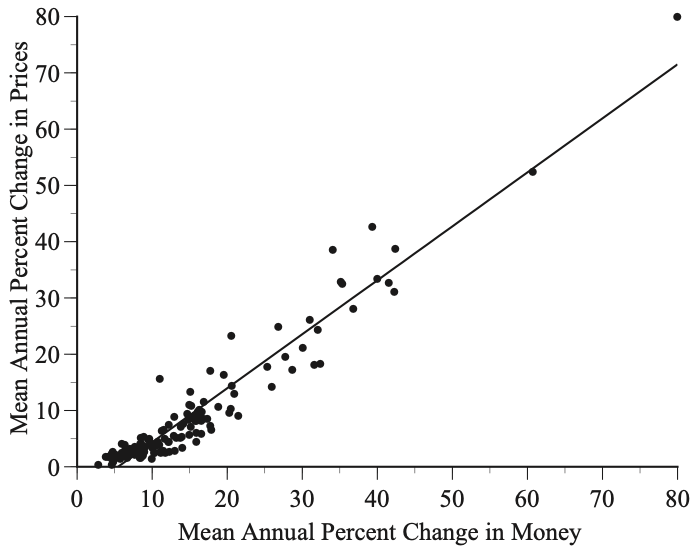
One obvious red flag is that the fitted line is heavily influenced by the observations for countries with very large increases in money and prices, especially the two countries that were reported to have had average annual growth rates of roughly 60% and 80% over this long time period. A second red flag is that Hanke reported that he omitted eight “outliers” but retained the 60% and 80% countries, even though they are clear outliers.
Request for data
I emailed Hanke, requesting the data used in this figure. Even though the journal that published his paper has an unambiguous policy requiring authors to make their data available to other researchers, Hanke initially ignored my request. He then emailed me a hodgepodge of raw data and offered the not-so-helpful comment that, “the methodology for making the calculations based on these data is clearly laid out in my article.” The inconsistencies between the data Hanke sent me and the results reported in his paper prompted me to examine the IMF data that were the basis for the data Hanke used in the article.
Ironically, these IMF data revealed several examples of sloppy science, detailed here. Here are two examples: First, there is no country in either Hanke’s data or the IMF data that experienced 80% annual growth rates of money and prices during this period. Second, Hanke repeatedly describes the money data as M2 but the IMF discontinued its M2 data in 2018. The data Hanke used are a splice of two different and not always consistent monetary aggregates, sometimes with large gaps at the splice points. Hanke ignored my repeated requests that he clarify the many data problems I found.
None of these problems appear to be intentional. It seems, rather, that Hanke did not pay sufficient attention to the details. When the results came out the way he wanted, he had no incentive to look at the details carefully.
The core problem
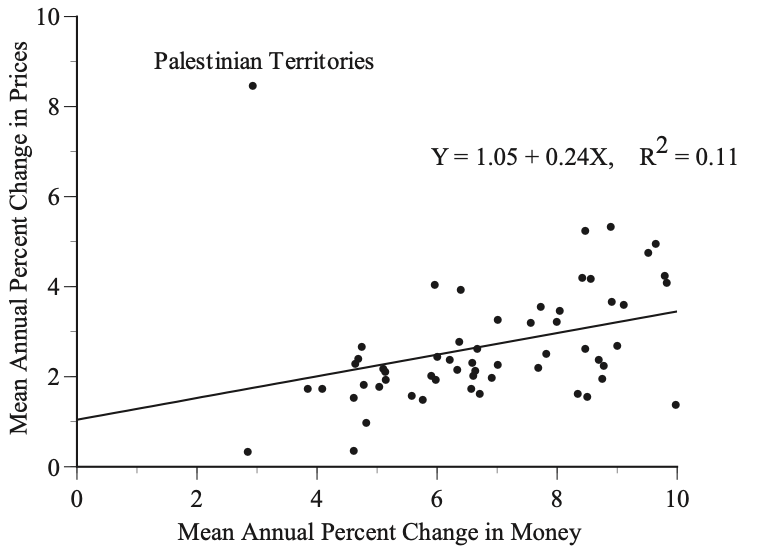
As for the core question of a tight link between money and inflation, there are two problems with Hanke’s analysis. First, large, sustained increases in prices are generally accompanied by large, sustained increases in various measures of money but there is only a loose relationship between money and prices during periods when money increases modestly. The scatterplot below for the 58 countries in Hanke’s data set that had single-digit annual increases in money shows there is not a close one-for-one relationship.
The second problem is that Hanke consistently refers to the government “money supply” affecting prices. The various monetary aggregates used in his paper are not exogenous variables controlled by federal governments but are, rather, endogenous variables that are affected, along with prices, by many economic variables.
For example, when a nation’s price level rises, national income and savings generally rise, too. If these savings increase the size of deposits in financial institutions, swelling M2, it would be misleading to say that the increase in M2 caused the increase in prices.
In a 2022 debate with John Cochrane about money and inflation, Hanke argued that his study demonstrates that M2 has a causal effect on prices:
Hanke: I related the growth rate in the money supply to the inflation rate [in] a base of 147 countries and the money supply measure I used is M2 and what do we end up with? We have almost a perfect correlation….
Cochrane: Correlation isn’t causation. We’ve known that forever…
Hanke: I also ran a regression with that and that does imply causation….
Cochrane: Oh, no no. Regressions don’t imply causation. Come, come now. Regressions imply correlation.
Cochrane is correct. Regressions can identify correlations but cannot prove causality.
The journal that published Hanke’s paper refused to publish my critique. I was informed:
I appreciate you disagree with Professor Hanky’s [sic] research or views and there are many platforms and sites on the internet that allow self publication when needed – SubStack springs to mind.
Science has enriched our lives enormously and we need to restore the luster of science and scientists. Journals should require authors to make their data available online before publication and encourage others to try to replicate the research they publish. Such measures would go a long way towards mitigating p-hacking, HARKing, fraud, pursuing agendas, and carelessness. Researchers will be less likely to sin if their sins are more likely to be discovered.