
Ransacking Flawed Data For Hidden Treasures Seldom Ends Well
The Internet provides a firehose of data that financial market researchers can use to interpret human behavior—but cherry-picked patterns usually vanishOne of my sons sometimes plays a game with his friends when they eat lunch at a restaurant. They all turn off their phones and put them in the center of the table. The first person to pick up the phone pays for lunch for everyone. The game seldom lasts long.
The loser of this game is never checking the weather, stock prices, or important news of the day. It is social media that has an irresistible lure. They want to see what other people are doing and share what they themselves are doing. Checking our phones has been likened to a gambling addiction: We are usually disappointed but, every once in a while, a big payoff keeps us coming back, hoping for another thrill.
For data scientists, one of the payoffs from the Internet is the creation of vast amounts of social media data that we can scrutinize for patterns from the comfort of our offices and cubicles. No longer must we run experiments, observe behavior, or conduct surveys.
I am a data scientist and I appreciate the convenience of data at my fingertips. But I am also skeptical of much of what passes for data these days. There is a crucial difference between data collected from randomized controlled trials and data that consist of the conversations people have on social media and the web pages they visit on the Internet.
An even more important problem, though, is that the explosion of data has vastly increased the number of coincidental patterns that can be discovered by tenacious researchers. If there are a relatively fixed number of useful patterns and the number of coincidental patterns is growing exponentially, then the ratio of useful patterns to useless patterns must necessarily be getting closer to zero every day.
Burton Crane (1901–1963), a long-time financial writer for the New York Times, offered this seductive advice on how to make big money in the stock market:
Since we know stocks are going to fall as well as rise, we might as well get a little traffic out of them. A man who buys a stock at 10 and sells it at 20 makes 100 per cent. But a man who buys it at 10, sells it at 14 1/2, buys it back at 12 and sells it at 18, buys it back at 15 and sells it at 20, makes 188 per cent.
Yes, it would be immensely profitable to jump in and out of the stock market nimbly buying before prices go up and sell before prices go down. Alas, study after study has shown how hard it is to time the market compared with a simple buy-and-hold strategy: Buy stocks and never sell unless the money is needed for a house, retirement, or whatever else investors are saving money to buy.
These dismal results haven’t stopped people from trying. In 2013, three researchers reported that they had found a novel way to time the market by using Google search data to predict whether the Dow Jones Industrial Average was headed up or down. They used Google Trends, an online data source provided by Google, to collect weekly data on the frequency with which users searched for 98 different keywords:
We included terms related to the concept of stock markets, with some terms suggested by the Google Sets service, a tool which identifies semantically related keywords. The set of terms used was therefore not arbitrarily chosen, as we intentionally introduced some financial bias.
The use of the pejorative word bias is unfortunate because it suggests that there is something wrong with using words related to the stock market. The misplaced conviction that correlation supersedes causation assumes that the way to discover new insights is to look for patterns unencumbered by what we think we know about the world—to discover ways to beat the stock market by looking for “unbiased” words that have nothing to do with stocks. The flaw in this blind strategy is that coincidental patterns will almost certainly be found, and data alone cannot distinguish between meaningful and meaningless patterns. If we have wisdom about something, it is generally better to use it—to introduce some financial expertise.
For each of these 98 words, the researchers calculated a weekly “momentum indicator” by comparing that week’s search activity to a moving average of search activity during the preceding weeks. The researchers considered moving averages of 1 to 6 weeks for each of their 98 keywords and reported that the most successful stock trading strategy was based on the keyword debt, using a 3-week moving average and this decision rule:
Buy the Dow if the momentum indicator is negative
Sell the Dow if the momentum indicator is positive.
Using data for the seven-year period January 1, 2004, through February, 22, 2011, they reported that this strategy yielded an astounding 23.0 percent annual return compared to 2.2 percent return for a buy-and-hold strategy. Their conclusion:
Our results suggest that these warning signs in search volume data could have been exploited in the construction of profitable trading strategies.
They offer no reasons for the remarkable performance gap:
Future work will be needed to provide a thorough explanation of the underlying psychological mechanisms which lead people to search for terms like debt before selling stocks at a lower price.
The fatal problem with this study is that the researchers considered 98 different keywords and 6 different moving averages (a total of 588 strategies). If they considered two trading rules (buying when the momentum indicator was positive or selling when the momentum indicator was positive), then 1,176 strategies were explored. With so many possibilities, some chance patterns would surely be discovered—which undermines the credibility of those that were reported.
Even a large collection of random numbers will yield some coincidentally profitable trading rules when we look backward—when we predict the past instead of predicting the future.
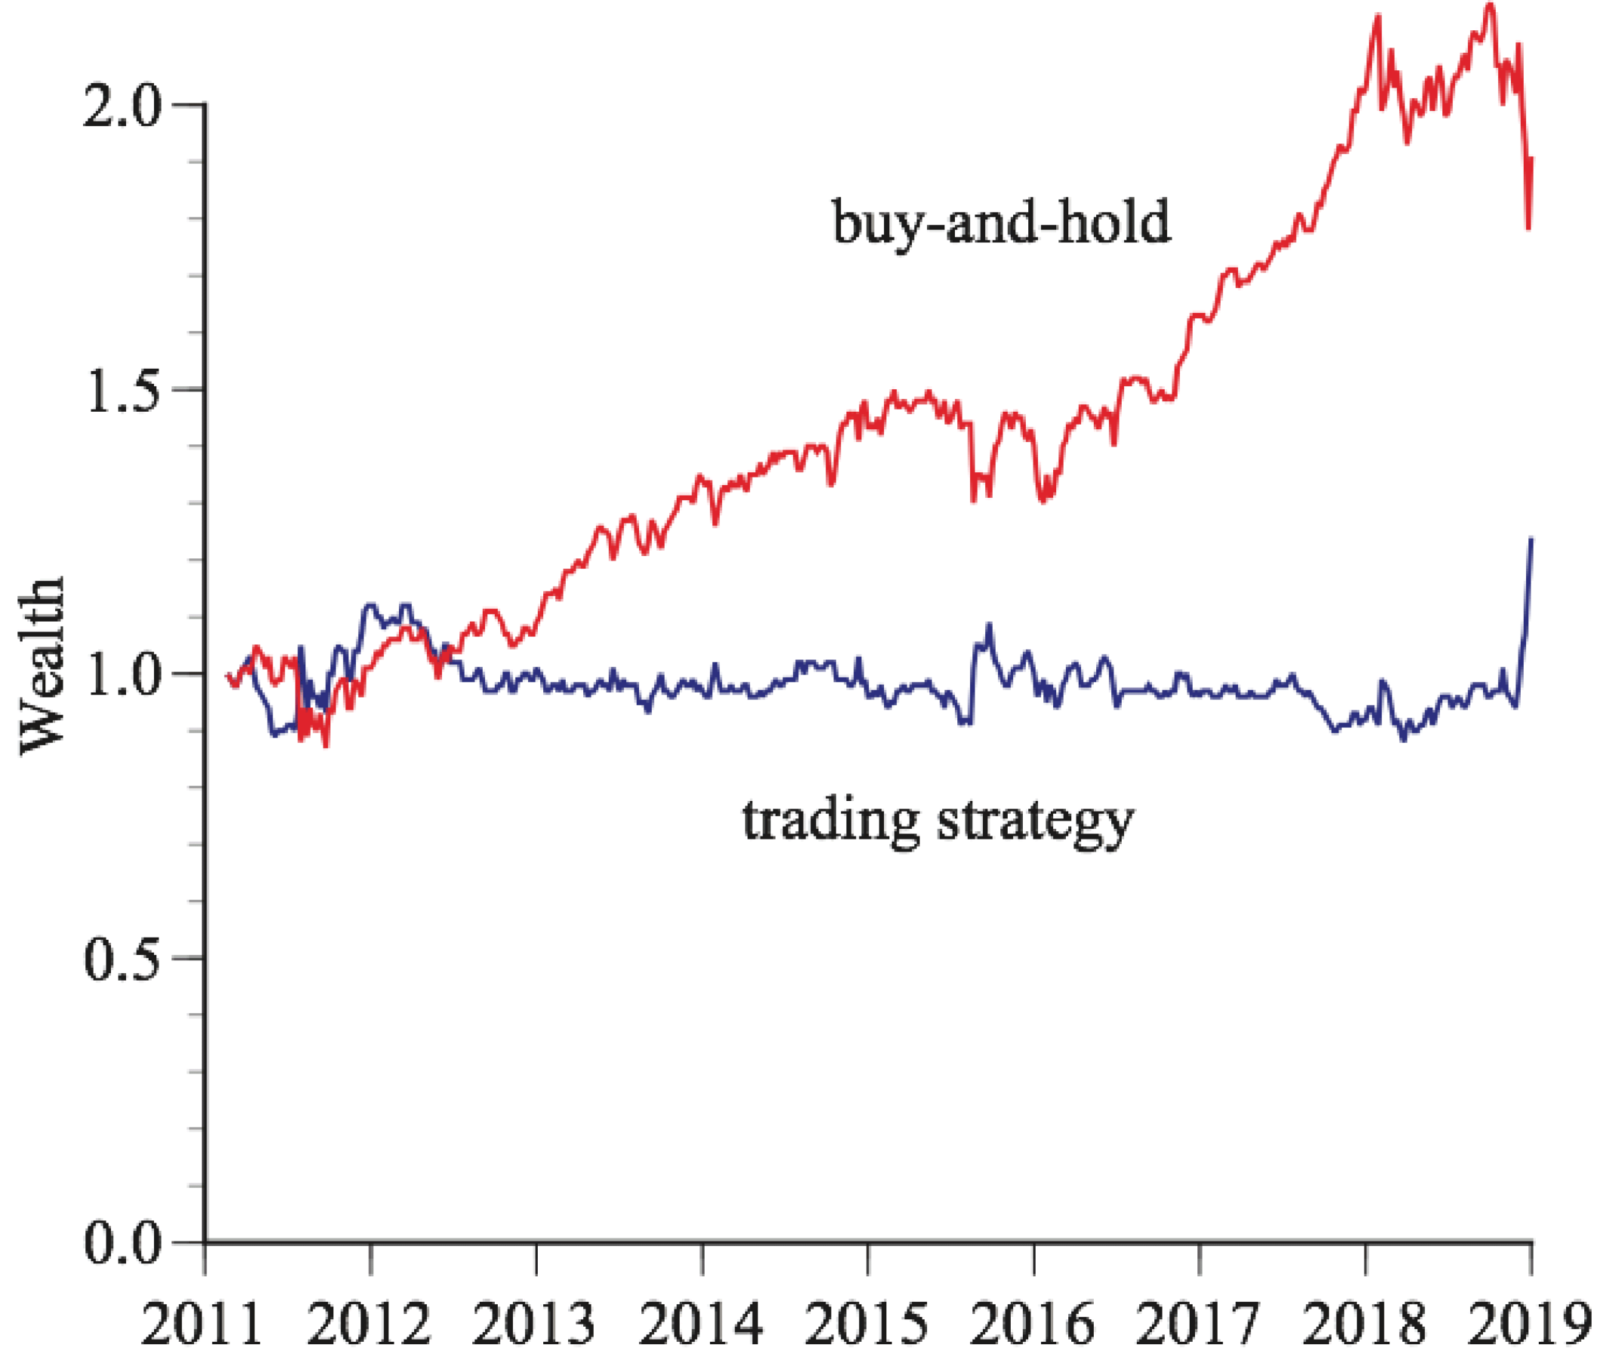
Let’s see how well their model did predicting the future over the next seven years, from February, 22, 2011, through December 31, 2018. Figure 1 shows the results. Their debt strategy had an annual return of 2.81 percent, compared to 8.60 percent for buy-and-hold. See Figure 1 Clumsily Staggering In and Out of the Market below:
It should be no surprise that the researchers’ data-mined strategy flopped when applied to fresh data. Cherry-picked patterns usually vanish.
I am not being facetious when I say that I sincerely hope that these researchers did not buy or sell stocks based on their data-mined strategy. On the other hand, a cynic once remarked that there’s something about losing money that really forces people to take a hard look at their decision-making.
The internet provides a firehose of data, including searches, clicks, and posts, that researchers can use to understand and predict people’s behavior. However, people using the Internet in general, and social media in particular, are surely unrepresentative and should be used with caution in drawing conclusions about the general population.
Things we read or see on the internet are not necessarily true. Things we do on the internet are not necessarily informative. An unrestrained scrutiny of searches, updates, tweets, hashtags, images, videos, or captions is certain to turn up an essentially unlimited number of phantom patterns that are entirely coincidental and completely worthless.
Ransacking flawed data for hidden treasures seldom ends well.
If you enjoyed this piece by economics professor and statistics analyst Gary Smith, you might also want to take a look at
Serious investors should embrace the stock market algos: We can use computers’ inability to distinguish meaning from noise in data to our advantage
We see the pattern! But is it real? It’s natural to imagine that a deep significance underlies coincidences. Unfortunately, patterns are not always a source of information. Often, they are a meaningless coincidence like the 7-11 babies this summer.
and
Investor, AI isn’t your big fix. In investing and elsewhere, an AI label is often more effective for marketing than for performance