
Using Data Like a Drunk Uses a Lamppost
Startup companies can be tempted to use statistics for support instead of real illuminationKarl Pearson, the great English mathematician and statistician, wrote, “Statistics is the grammar of science.” At its finest, it is. Statistical data and methods are the backbone of the scientific method that underlies the astonishing scientific advances that humans have made.
Unfortunately, statistics can also be used to provide misleading support for false claims. The examples are numerous and so are the laments:
There are three kinds of lies: lies, damned lies, and statistics.—Benjamin Disraeli
There are two kinds of statistics, the kind you look up and the kind you make up.—Rex Stout
Definition of Statistics: The science of producing unreliable facts from reliable figures. —Evan Esar
If you torture the data long enough, they will confess.—Ronald Coase
We couldn’t help but think of these biting words when we read a recent LinkedIn post by Peter Walker, who runs the Insights team at Carta, a software company that collects, manages, and analyzes startup company data.
Startups Are Struggling
Startups typically go through a sequence of private funding rounds—Seed, Series A, Series B, Series C, and (possibly) Series D or higher before going public through an initial public offering (IPO). Startups were red hot a few years ago but have struggled mightily recently because of high-interest rates and dismal profits.
Of those startups (“unicorns”) valued at more than $1 billion when they went public, 90 percent are currently unprofitable; 21 now have more than $3 billion in cumulative losses, including Uber ($33 billion), WeWork ($16 billion), Rivian Automotive ($14.4 billion), Teladoc Health ($11 billion), and Lyft ($9.3 billion). The results are even bleaker for companies that have not done well enough to go public.
Investors are now realizing that many (most?) startups are little more than fake-it-til-you-make-it puffery. Venture capital investment in Series B and C funding has plummeted from $89 billion in 2021 to $57 billion in 2022 and $20 billion in the first half of 2023. There were only 80 IPOs in the first half of 2023, compared to 1083 in 2021.
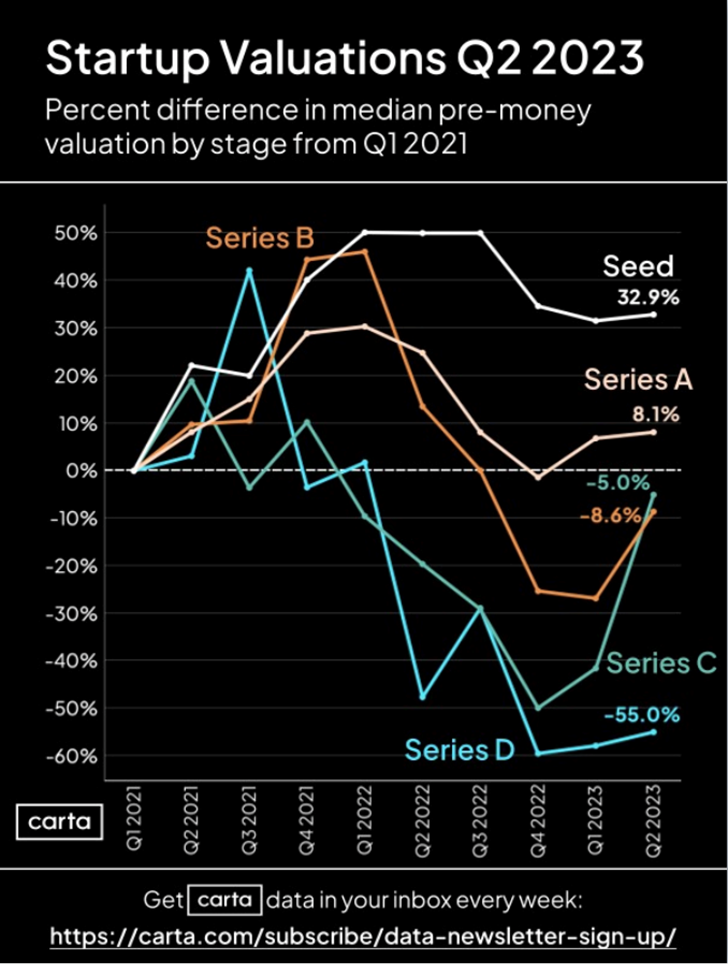
Against this bleak background, Walker’s LinkedIn page posted this graphic:
Here are highlights from Walker’s accompanying commentary:
Don’t tell anyone – but startups may be making a comeback.
Here’s our First Cut of Carta data on valuations for the just completed Q2. Data drawn from over 38,000 US cap tables.
Biggest takeaway?
Every stage, from seed to series D, saw the median pre-money valuation rise this quarter.
Carta seems to be a useful company and Walker seems to have a cool job—running the “Insights team.”
Carta’s website provides a fuller description of Walker’s job:
Peter Walker runs the Insights team at Carta, focused on discovering key data and narratives across the private capital ecosystem. In a former life, he was a marketing executive for a media analytics startup and led the data visualization team at the Covid Tracking Project.
On Walker’s LinkedIn page, he describes himself as a “Data Storyteller.”
A skeptic might suspect a conflict of interest here when Carta touts a “startup comeback” and, while we don’t want to stereotype, it is hard to ignore Walker’s background as a marketing executive and his self-description as a “data storyteller.”
The graph does indeed show several lines that are positive or close to being positive and all five lines headed upward over the last 3-to-6 months. Positive is good. Up is good.
But what, exactly are these lines? The Seed money line, for example, shows the following:
Comparing those startups that successfully received seed funding in the second quarter of 2023 with those startups that successfully received seed funding in the first quarter of 2021, the median valuation of the 2023 companies before they received their funding was 32.9% higher than the median valuation of the 2021 companies before they received their funding.
Walker’s optimistic interpretation is that startup valuations are increasing, but that is not at all what the lines are telling us.
It’s All in How You (Mis)Interpret the Data
These are the pre-funding valuations of companies that successfully received funding, which is a very non-random sample of all companies. The most natural interpretation of these data is that this is negative news in that investors are now requiring higher valuations before they commit money. It is not that startups are becoming more valuable but that investors are becoming stingier.
Beyond this complete reversal of the interpretation of the numbers, there are plenty of things wrong with the underlying data, starting with the fact that we don’t know whether the companies included in each quarter’s data are comparable. Perhaps companies in some periods happen to have higher valuations simply because they are bigger companies or in different industries.
There is an analogous problem with traditional real estate data that track average (or median) sale prices. The average price might go up or down in one quarter because bigger or smaller homes happened to be on the market or because the homes happened to be in better or worse locations. The price of a large home bought in San Mateo in the second quarter of 2023 might be much higher than the price of a small home bought in Death Valley in the first quarter of 2021. That price difference is not a good measure of the change in home prices in California between these two periods.
In real estate, repeat-sales indexes are used to handle that problem. A comparable metric for startups would track individual companies. Of those companies that get funding, how much does their valuation increase over time relative to that funding?
Real estate prices can also be tracked by using multiple regression models that explain prices based on square footage, the number of bathrooms, and so on. We can then see, for example, if the price per square foot is increasing, taking into account location and other factors that evidently matter to home buyers. A comparable approach here would be a multiple regression model that explains the size of funding based on company characteristics. This is, no doubt, impractical because, unlike real estate, so much company data are proprietary and so many startups fail and disappear from the database.
Walker’s graphic does not show that startups are making a comeback. It does demonstrate that, in the words of Andrew Lang, “He uses statistics as a drunken man uses lamp posts—for support rather than illumination.”