
Confusing Correlation with Causation
Computers are amazing. But they can't distinguish between correlation and causation.Artificial intelligence (AI) algorithms are terrific at discovering statistical correlations but terrible at distinguishing between correlation and causation. A computer algorithm might find a correlation between how often a person has been in an automobile accident and the words they post on Facebook, being a good software engineer and visiting certain websites, and making loan payments on time and keeping one’s phone fully charged. However, computer algorithms do not know what any of these things are and consequently have no way of determining whether these are causal relationships (and therefore useful predictors) or fleeting coincidences (that are useless predictors).
If the program is black box, then humans cannot intervene and declare that these are almost certainly irrelevant coincidences. Even if the program is not black box and can be supervised, humans may be reluctant to wave a red flag. First, we are too quick to defer to computers, misbelieving that they are smarter than us. Second, our distant ancestors found that recognizing patterns had survival and reproductive value. Leaves turning brown means winter is coming. A line of elephants often leads to water. We are now hard-wired to look for patterns and to think that the patterns we find are meaningful.
The insurance, employment, and loan application examples above are all real and, in each case, they were not black box and humans believed that the relationships were causal and could be used to make profitable predictions.
We might hope that we will learn from statisticians’ exhortations and sad experience that correlation isn’t causation but, if so, we would be disappointed.
For instance, a popular investment strategy in the early 1980s was based on the gold-silver ratio (GSR), which is the ratio of the price of an ounce of gold to the price of an ounce of silver. The GSR fluctuated around the range 34 to 38 during the years 1970 through 1985, suggesting that convergence trades would be profitable whenever the GSR was temporarily outside this range. In 1985 the GSR went above 50, leading some investment advisors to recommend selling gold futures while buying silver futures, counting on the price of gold to fall relative to the price of silver so that the GSR would go back below 38.
The inescapable problem is that there is no reason for the ratio of the price of gold relative to the price of silver to be any particular number, so investments based on the GSR are fool’s gold. The GSR averaged 36 for the years 1970 through 1985, but has been all over the place since then, seldom going below 38, going as high as 123, and averaging 69.
Déjà vu, déjà vu. In 2017 Steve Hanke touted the ratio of the price of oil to the price of gold as a “golden constant.” After claiming that he had used this golden constant to predict that the price of West Texas Intermediate (WTI) would plunge from its June 2014 high, he explained that,
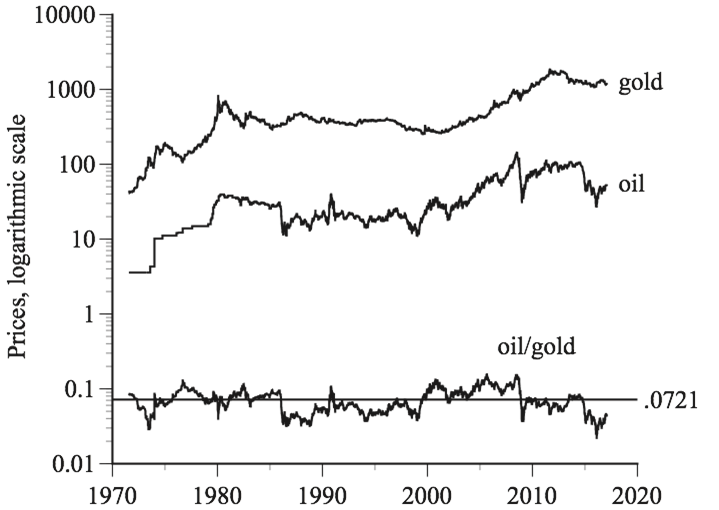
I developed a model. It employs the price of gold as a long-term benchmark for the price of oil. The idea being that, if the price of oil changes dramatically, the oil-gold price ratio will change and move away from its long-term value. Forces will then be set in motion to move supply and demand so that the price of oil changes and the long-term oil-gold price ratio is reestablished. This represents nothing more than a reversion to the mean. It explains why spot prices of gold and crude are parallel to each other and why the oil-gold price ratio hovers around 0.0721 (see the accompanying chart).
The observation that the price of oil and the price of gold both tend to increase over time reminds me of the so-called Pizza Principle, which says that the cost of a subway ride in New York City is equal to the cost of a slice of pizza. Pizza prices and subway prices have both increased over time and happened to be roughly equal in the 1960s and 1970s but, because neither has anything to do with the other, their prices have been uncoupled in recent decades.
So it is with the prices of oil and gold. They both tend to increase over time but (just like the prices of gold and silver) neither has anything to do with the other. Hanke’s appeal to “reversion to the mean” is misplaced. The regression-toward-the-mean principle says that when something is measured imperfectly, measurements that are far from the mean overstate how far the trait being measured is from the mean. The winning score in a golf tournament usually overstates how far the winning golfer’s ability is from the mean, so the golfer’s score in the next tournament will probably be closer to the mean. This principle is important but it does not imply that the ratio of the price of oil to the price of gold is constant.
What about Hanke’s accompanying chart? Here is my rendition, showing the spot price of gold, the spot price of WTI, the price ratio, and the 0.721 average value of the price ratio. Notice that the vertical axis is a logarithmic scale. This is often useful for data like gold and oil prices that increase substantially over time. However, it is potentially misleading to use a log scale for something like the oil/gold price ratio that has no long-run trend.
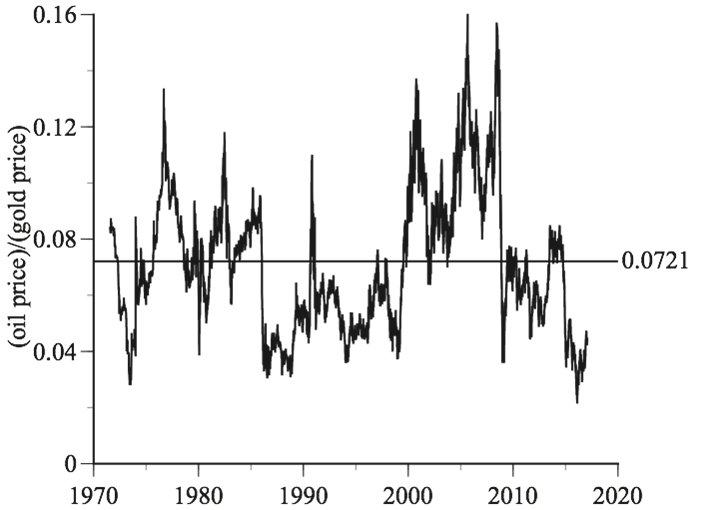
I have written about how a log scale on the horizontal axis can create an illusion of explosive growth. A log scale on the vertical axis can create an illusion of stability. The following figure shows that, with a linear scale, the oil/gold ratio has been far from constant, ranging from 0.021 (more than 70% below its average value) to 0.16 (more than twice its average value). The visual stability with a log scale is misleading.
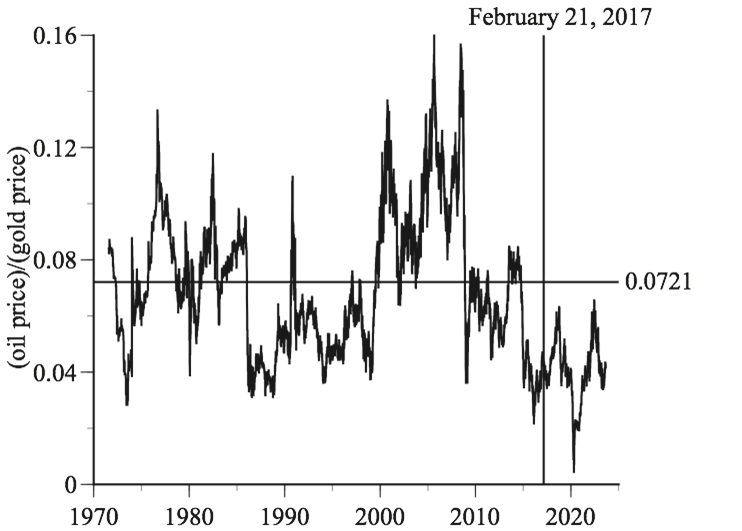
Hanke concludes by using his 0.0721 golden constant to make a confident prediction that the price of oil will jump from $53.70 on February 20, 2017, to $70 by the end of the year. Alas, as Ed Yardeni has quipped, if you give a number, don’t give a date. The price of WTI was $60.46 at the end of 2017, peeked above $70 in May 2018, and then fell back below $50 by the end of 2018.
The oil/gold ratio has not returned to its so-called golden constant of 0.0721. In the six-plus years since Hanke touted this magical number, the oil-price ratio has averaged 0.0408. Investors who have been long oil and short gold, expecting a convergence, have paid dearly for their misplaced faith.
The unwelcome truth is that magical ratios and golden constants based on fleeting coincidences are seductive but useless.
I love computers. I love mapping software. I love do-it-yourself instructions on the Internet. I love writing books on a computer. I use computers almost every day to make calculations that would otherwise take hours, days, years, even lifetimes. However, computers have many downsides. One is that they are so good at discovering useless correlations. Until they are able to distinguish between correlation and causation (which, I expect, will be a very long time), it is up to us to do that. No matter how close the correlation, no matter how powerful the computer that discovered it, no matter how prominent the person who touts it, correlation is not causation.