
An Illusion of Emergence, Part 2
A figure can tell a story but, intentionally or unintentionally, the story that is told may be fictionI recently wrote about how graphs that use logarithms on the horizontal axis can create a misleading impression of the relationship between two variables. The specific example I used was the claim made in a recent paper (with 16 coauthors from Google, Stanford, UNC Chapel Hill, and DeepMind) that scaling up the number of parameters in large language models (LLMs) like ChatGPT can cause “emergence,” which they define as qualitative changes in abilities
that are not present in smaller-scale models but are present in large-scale models; thus they cannot be predicted by simply extrapolating the performance improvements on smaller-scale models.
They present several graphs similar to this one that seem to show emergence:
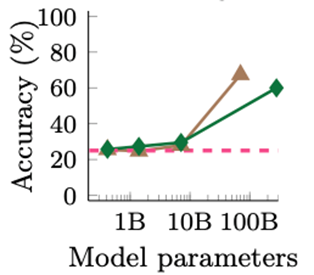
However, their graphs have the logarithms of the number of parameters on the horizontal axis. In order to demonstrate how this can be misleading, I considered a hypothetical model in which accuracy is a linear function of the number of parameters, evaluated at very different scale levels:
When this model is graphed with the number of parameters on the horizontal axis, there is no indication that quantitative changes in the number of parameters cause qualitative changes in model accuracy. Indeed, contrary to their definition of emergence, accuracy with a larger number of parameters can be predicted perfectly by a simple linear extrapolation of small-scale performance. If, instead, the logarithm of the number of parameters is used on the horizontal axis, this creates a misleading impression of a sudden explosion in the model’s accuracy as it scales up.
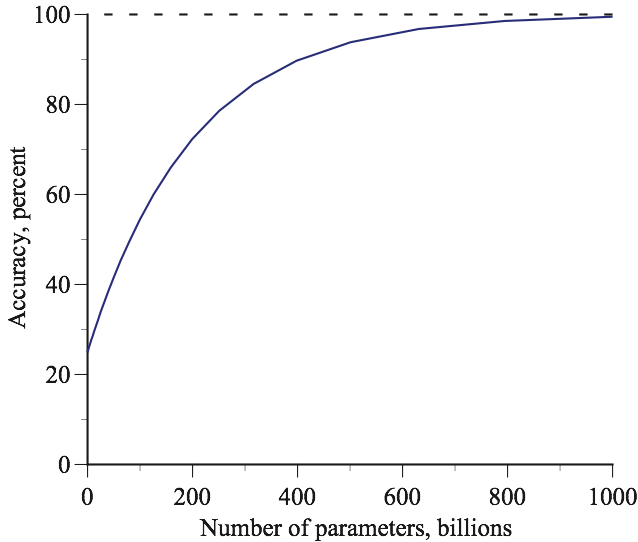
A few readers contacted me with the reasonable complaint that my assumed linear model cannot be correct for all scales because it implies that, at some point, the accuracy goes above 100 percent which is, of course, impossible. To solve this problem, I have now specified an alternative model that does not have this flaw and actually demonstrates my argument even more dramatically:

where Y is the model’s percent accuracy and X is the number of parameters (in billions).
The figure below shows that this model is consistent with the numbers given in my earlier piece and also keeps the model’s accuracy from going above 100 percent. This graph of accuracy versus the number of parameters shows that there are diminishing returns to increasing the number of parameters. Specifically, the marginal effect on accuracy of increasing the number of parameters is given by the slope of the line, and this slope declines as the number of parameters increases.
In economics, this is known as the law of diminishing marginal returns. When I was teaching economics at Yale’s graduate school, the Economics Club printed up some T-shirts with this call to action:
Repeal the Law of Diminishing Marginal Returns!
The appeal of this nerd-joke reflects the widespread truth of the “Law.” In many businesses, there comes a point where increases in one of the factors of production has smaller and smaller effects on output. In farming, for example, the marginal benefits of additional water, sunshine, and nutrients diminishes as more are added. The same is true of hiring more employees in most factories and in retail establishments like restaurants, grocery stores, and clothing stores.
The law of diminishing returns is often observed outside manufacturing and sales. A fifth ice cream cone is not as satisfying as the first. Going in the other direction, losing the first 10 pounds on a diet is easier than losing the next 10 pounds. When athletes first begin training for a sport, performance improvements come quickly. Then, as their performance gets closer to their genetic potential, it takes substantially more training to achieve even modest performance improvements. The same is true of learning to play a musical instrument, mastering a game like chess on bridge, studying to pass an examination. It is also true of editing essays, debugging computer code, and cleaning a kitchen. Perfectionists can be exhausted by the law of diminishing returns.
It is hard to think of exceptions to the law of diminishing returns and it is plausible that it holds for LLMs: The accuracy improvements that come from increasing the number of parameters from 1 billion to 2 billion are likely to be larger than the gains from increasing the number of parameters from 1,000 billion to 1,001 billion.
The model shown in the above figure reflects this presumption. However, if the logarithm of the number of parameters is put on the horizontal axis, then the visual appearance is reversed: there appears to be an explosive emergence as the number of parameters increases past 10 billion:
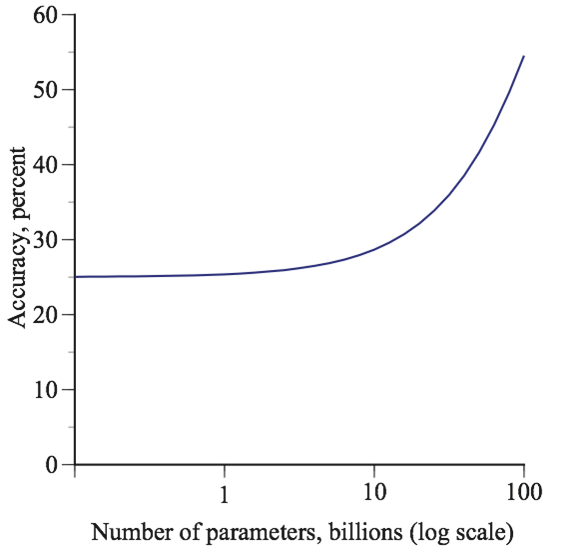
The contrast between visual impression given by these two figures is dramatic. One shows diminishing returns; the other shows escalating gains.
Both of these graphs are sensible. By putting logarithms on the horizontal axis, we are looking at percentage changes in the number of parameters and, while the accuracy gains that come from increasing the number of parameters from 1 billion to 2 billion are likely to be larger than the gains from increasing the number of parameters from 1,000 billion to 1,001 billion, they are likely to be smaller than the gains that come from increasing the number of parameters from 1,000 billion to 2,000 billion.
The problem is not with the model but with the visual illusion in the second graph. Scaling up does not cause qualitative changes that “cannot be predicted by simply extrapolating the performance improvements on smaller-scale models.” The changes are quantitative and can be predicted perfectly by simple extrapolation.
This new model reinforces my original point. A figure can tell a story but, intentionally or unintentionally, the story that is told may be fiction. The use of logarithms on the horizontal axis can sometimes completely change the story’s visual punchline.