In Science, We Can’t Just “Settle” for Data Clusters
The board game, Settlers of Catan, offers a clear illustration of what can go wrong when we are duped by data clustersSettlers of Catan is an incredible board game created by Klaus Teuber, a German game designer. It has been translated into dozens of languages and tens of millions of sets have been sold. The basic four-player board consists of 19 hexagons (hexes) representing resources: 3 brick, 4 lumber, 4 wool, 4 grain, 3 ore, and 1 desert. Players acquire and use resources based on dice rolls, card draws, trading, and the location of their settlements and cities.
Part of the game’s seductive appeal is that there are many, many ways to arrange the 19 hexagons and successful strategies depend on how the hexagons are arranged. The rules are simple but winning strategies are complex and elusive.
The official rules of Catan recommend that the 19 hexes be shuffled, randomly placed face down on the board, and then turned over. Two hex arrangements are shown below. Which Settlers board looks more random to you?

Figure 1 An Unbalanced Settlers Board
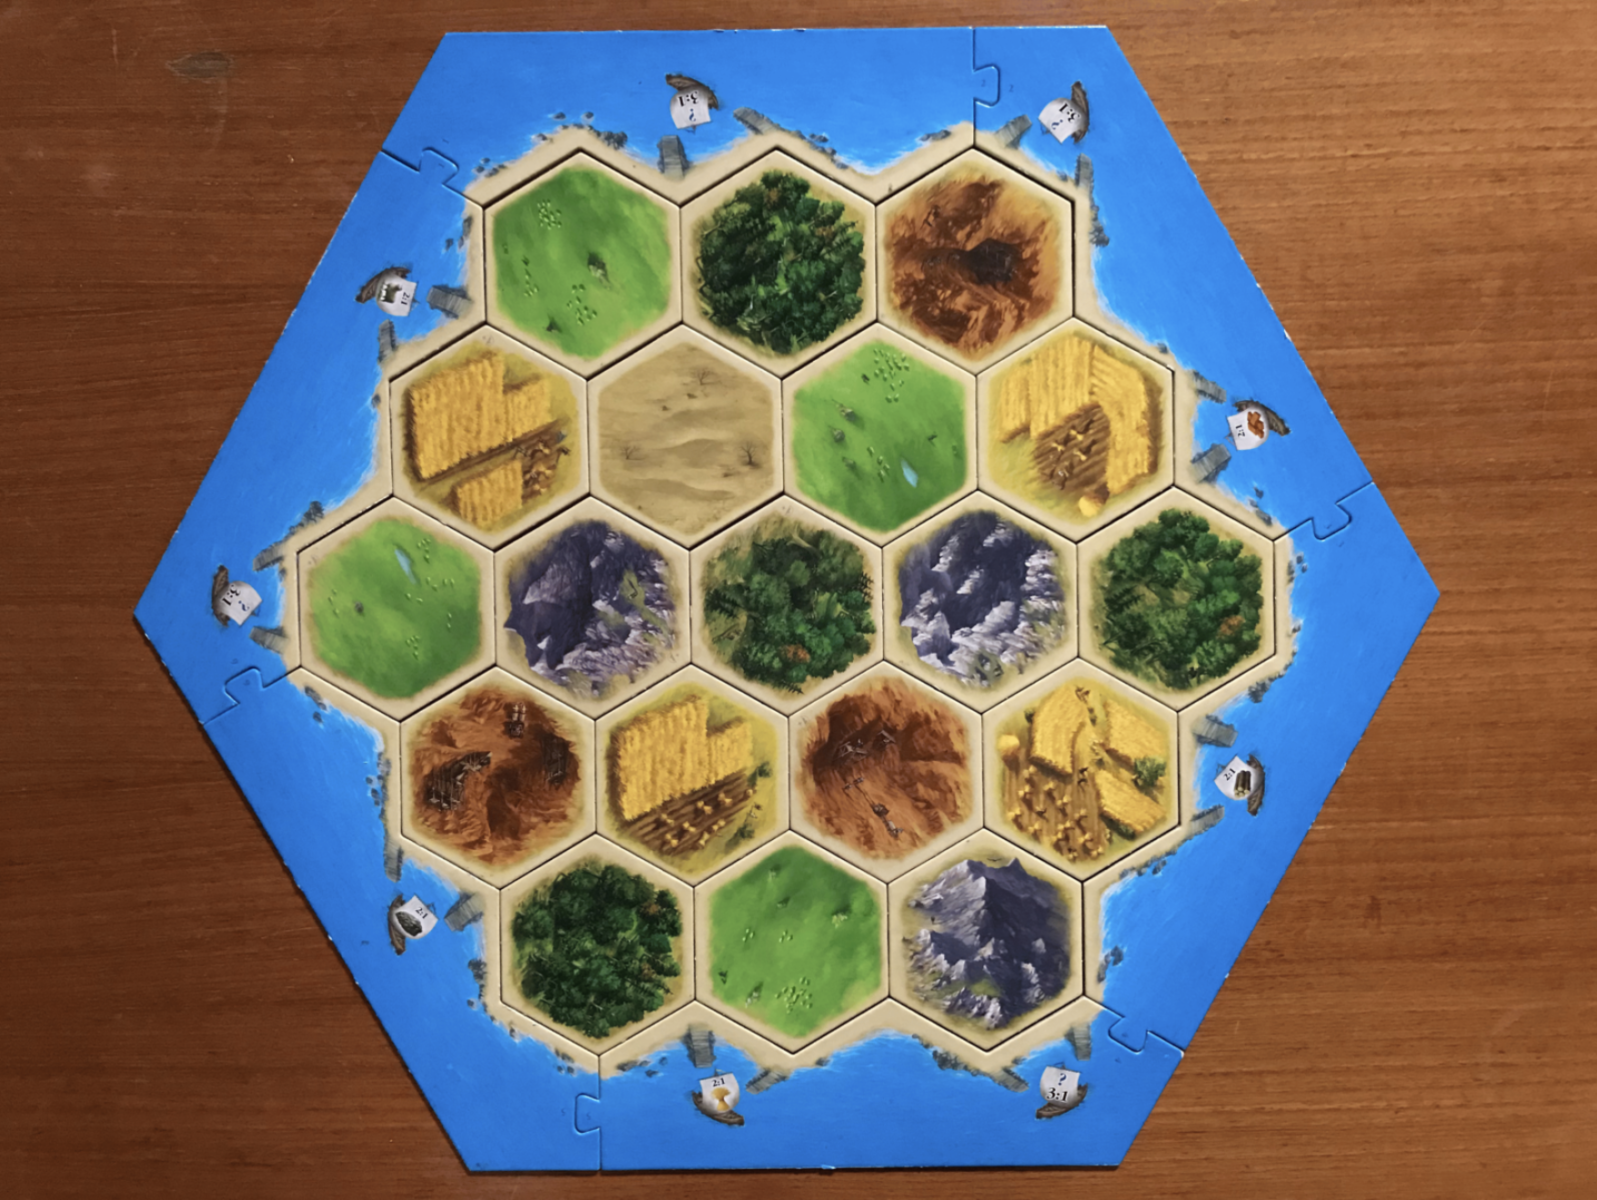
Figure 2 A Truly Random Settlers Board?
Most people think that there is something “wrong” with the board in Figure 1 because it has three lumber hexes clustered together. We have a deep-rooted tendency to think that clusters are unlikely to occur randomly — whether it be four heads in a row when a coin is tossed or three lumber hexes locked in a triplet when the Catan board is set up. However, it is a misconception to think that either heads/tails or Settlers hexes should alternate.
Catan players are often dismayed when they turn over a random arrangement of hexes and find a cluster, like the three lumber resources locked together in a triplet in Figure 1. The board doesn’t appear to be random so the players start moving hexes around until they find a layout like Figure 2 that appears random.
The reality is that randomly placed hexes often feature striking coincidental patterns. Predicting a specific pattern beforehand is difficult. Detecting some pattern after the fact is expected. But there is a 29 percent probability that a randomly constructed Catan board will have at least one triplet, as in Figure 1. There is only a 4 percent chance of a board like Figure 2, in which no adjacent hexes are the same.
Catan is more fun if players accept the fact that clusters should be expected — indeed welcomed — instead of limiting the number of possible board setups by misguided notions of what randomness looks like.
This clustering principle applies to matters far more serious than board games. Suppose that the 19 Settlers hex locations are 19 small cities, each with 100 residents, and that each person has a 10 percent chance of developing invasive cancer before the age of 60, irrespective of where he or she lives.
A random number generator was used to determine whether each imaginary person develops cancer before the age of 60. Figure 3 shows the outcomes of this computer simulation:
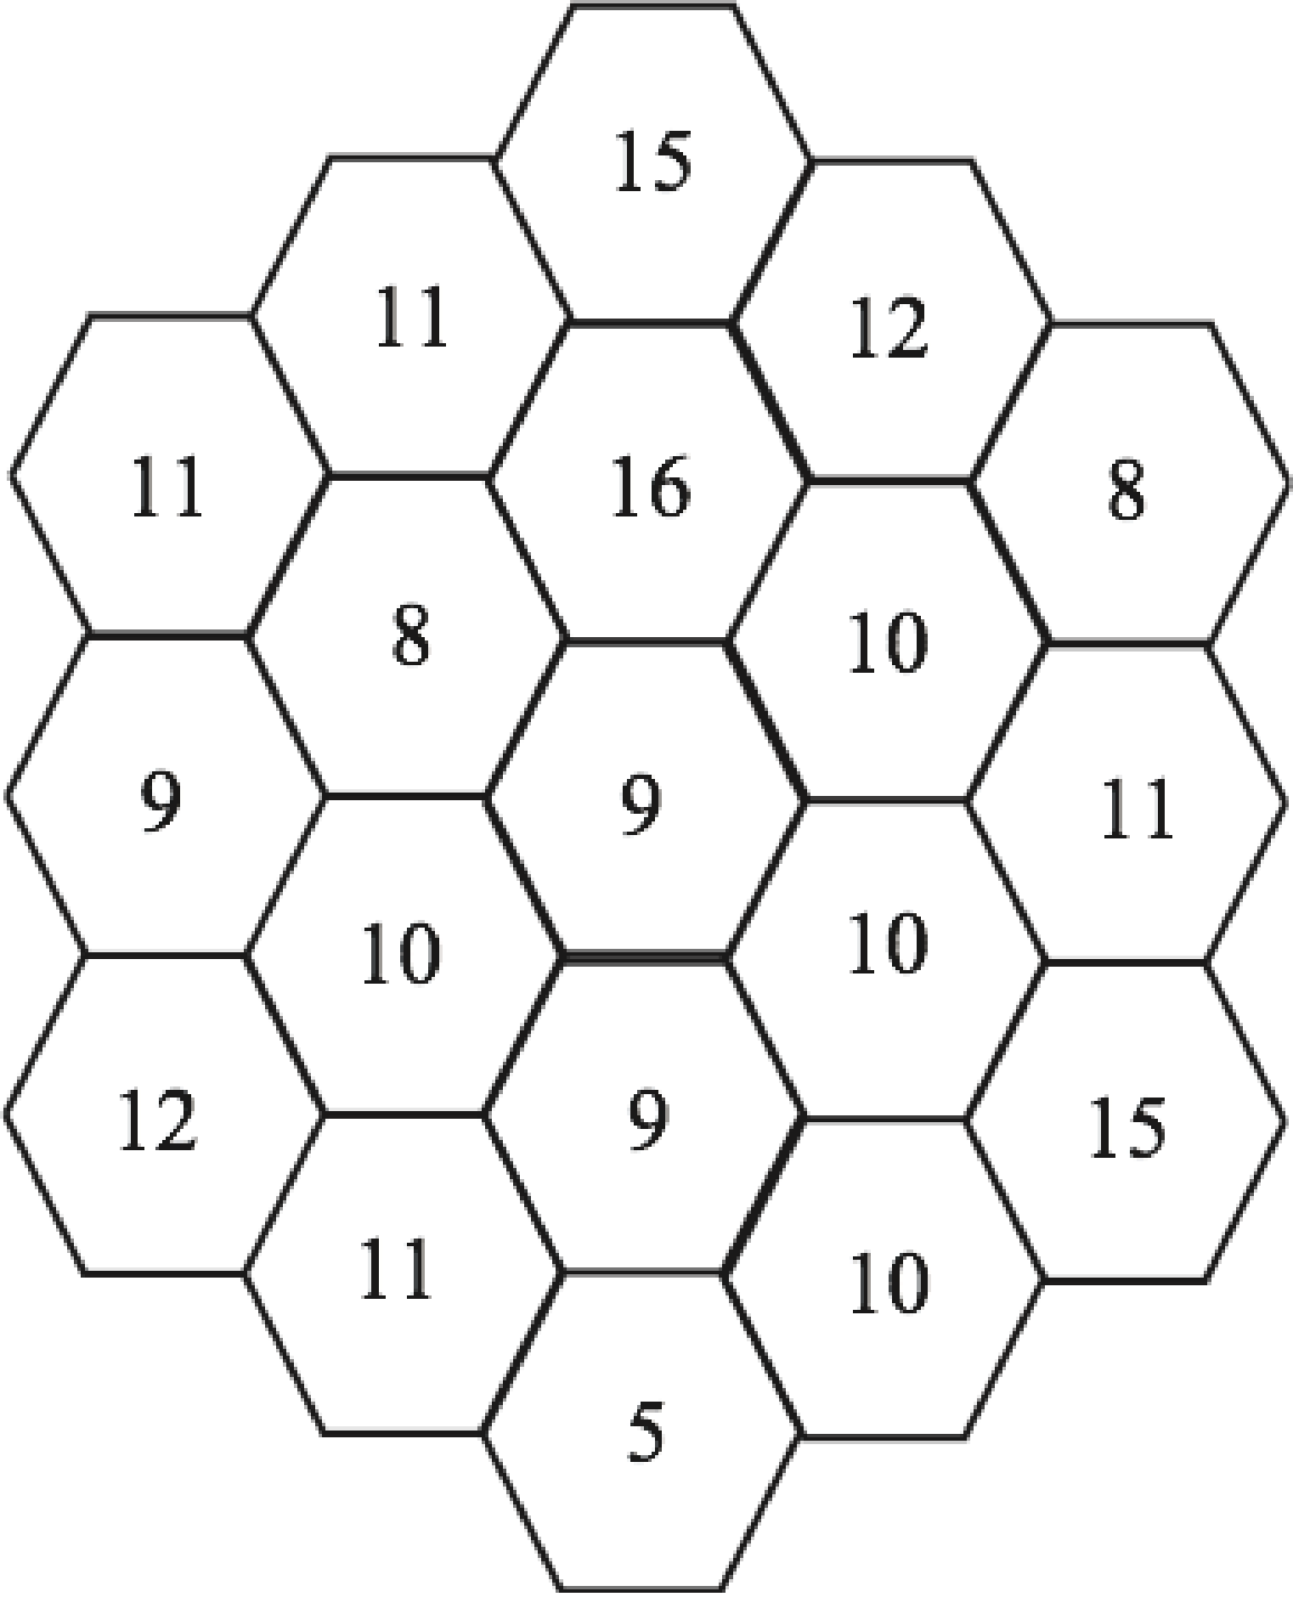
Figure 3 Cancer Incidence in 19 Small Towns
These results were not unusual. With a 100 people in each city and a 10 percent chance of developing cancer, we expect, on average, 10 people in a city to develop cancer. In the simulation, the city average is an unremarkable 10.63, which, as expected, is close to 10 but not exactly 10. Nor is it remarkable that one city had 16 people develop cancer and another city had only 5. With 19 cities, the probability that at least one city will have 16 or more cancer victims is 55 percent and the probability that at least one city will have 5 or fewer is 66 percent. As with Catan, clusters are the norm.
If these were real cities and we didn’t appreciate how often random data cluster, we might think that the cities with 16 and 5 cancer cases are remarkable. We might then try to find an explanation. We might also notice that two adjacent cities in the center north of the map had 15 and 16 cases, while the center-south city had only 5, and think this is important. With a little snooping, we might discover a cell tower in the northern part of the region. We might conclude that living near a cell tower causes cancer and living far from a cell tower reduces the chances of developing cancer. Or we might discover a water tower in the southern part of this region and conclude that living near a water tower protects one from cancer and living far from a water tower increases the chances of developing cancer.
If more towns were added to the cluster, even more extreme results would be likely, due to nothing more than the fickle nature of luck. For example, with 1,000 towns, there is a 92 percent chance that at least one city will have 20 or more cancer victims and an 80 percent chance that at least one city will have 2 or fewer. If we saw one city with 20 cases and another with only 2 cases, it would be tempting to search for an explanation. We would surely find differences between these cities — perhaps in schools, parks, trees, water towers, or power lines — that seem important, but aren’t.
In the 1970s there was, in fact, a much ballyhooed report which found that exposure to electromagnetic fields (EMFs) from power lines cause cancer. It was based on an epidemiologist’s discovery that some of the homes of people who had died of cancer before the age of 19 were located near power lines. The reality is that scientists know a lot about EMFs and there is no plausible theory for how power line EMFs might cause cancer. The electromagnetic energy from power lines is far weaker than that from moonlight and the magnetic field is weaker than Earth’s magnetic field. Despite subsequent studies and experiments refuting the claim, many people still think that power lines cause cancer. Once the toothpaste is out of the tube, it is hard to put it back in.
The more general point is that in our age of Big Data, there is a virtually unlimited number of coincidental data sequences, correlations, and clusters. Those who mistakenly place data before theory and use data-mining computer algorithms to discover something — anything — in large databases are sure to succeed. Those who do not appreciate the inevitability of patterns are sure to be impressed. Those who are seduced by these shiny patterns are likely to be disappointed.
This is also the Achilles’ heel of artificial intelligence (AI) programs that are nothing more than relentless data-mining algorithms. They are very, very efficient at finding patterns — and completely worthless at discerning whether the patterns they discover are meaningful or meaningless.
You may also enjoy these pieces by Gary Smith on misunderstanding/misuse of statistical probability:
Female hurricanes: How a mass of hot air became a zombie study. When a reporter first asked me about a study claiming that “Female Hurricanes are Deadlier than Male Hurricanes,” I was sceptical. Do sexist humans die because they don’t take hurricanes with female names seriously? No, the study is seriously flawed.
Is “hot hands” just a basketball myth? Not so fast…
The World Series: What the luck? Who will win the World Series? I don’t know, but I do know that baseball is the quintessential game of luck
and
The paradox of luck and skill: Why did Shane Lowry win the British Open golf championship? Because someone had to. In any competition including academic tests, athletic events, and company management where there is an element of luck that causes performances to be an imperfect measure of ability, there is an important difference between competitions among people with high ability and competitions among people of lesser ability.